75,000 Predictions Per Match: AI in Football
Authors: Michael Horton, Patrick Lucey, Vitaliy Kanev

Why It Matters
Picture this: Fulham vs. Aston Villa, 62nd minute, a red card is shown. The commentator says «this changes everything» — but how much does it really change? What’s the probability Fulham scores again? How many passes will each remaining player complete before the final whistle?
Until recently, answering these questions required expert intuition and simplified statistical models. But Michael Horton and Patrick Lucey from Stats Perform — the company behind the legendary Opta data system — have built a neural network that answers all of these simultaneously. And it does so roughly 75,000 times per match with sub-second latency.
The AI sports analytics market is booming: from $1.7 billion in 2025 to a projected $8.5 billion by 2033. This work represents one of the most ambitious applications of transformer architecture to real-time sports forecasting to date.
The Core Idea
The key breakthrough is a single neural network that simultaneously predicts 13 action types (goals, passes, shots, fouls, corners, etc.) for every player, both teams, and the match as a whole.
Axial Transformer — a variant of the transformer architecture where the attention mechanism is split across two axes: temporal and spatial. Instead of every element attending to all others at once (which is computationally expensive), the model first analyzes connections along one axis, then the other.
Think of it like a chess analogy: a standard transformer is a queen that sees the entire board at once. An Axial Transformer is a rook that first scans horizontally (time), then vertically (players). Information still reaches every square, but far more efficiently.
In-game forecasting — predicting outcomes and statistics not before the match, but during play, updating after every significant event (goals, fouls, substitutions, corners).
The model receives data about the current match state — score, time, player positions, accumulated statistics — and predicts how everything will end. It does this not once, but updates predictions after each of the ~150 events per match.
How It Works

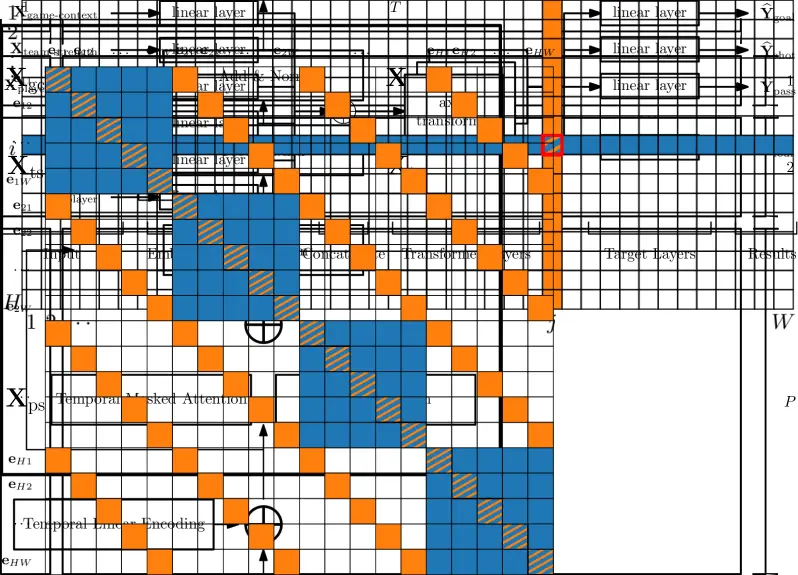
Fig. 1: Model architecture. Blue and orange indicate attention masks: row (temporal) and column (agent) attention. Source: Horton & Lucey, 2025
Input data: five information types
The model accepts five categories of input tensors:
- Player features (live): position, team, running action totals
- Player strength features (pre-game): historical statistics from recent matches
- Team features (live): aggregate action counts
- Team strength features (pre-game): historical performance metrics
- Game state: event type, clock time, score, dismissals
Two-axis attention: time × players
The key innovation is a weighted summation of two attention types:
-
Row attention (temporal): each timestep attends to all previous timesteps for a single agent. This captures match dynamics: is the team pressing, dominating possession, or sitting back?
-
Column attention (agent): within a single timestep, all players and teams can see each other. This models interactions: if a fast striker comes on as a substitute, the opposition defenders will face more work.
Self-attention — a mechanism where each element in a sequence «decides» which other elements deserve the most focus. In football terms: the model determines on its own that a defender’s red card in the 62nd minute matters more than a corner in the 15th.
The authors mathematically proved that their approach is equivalent to standard sequential self-attention with a specific mask, but computationally far cheaper: O ((H+W)·H·W) instead of O (H²·W²).
Training
- Dataset: 62,610 matches from 28 competitions
- Training set: 58,501 matches (2016/17 through 2023/24 seasons)
- Test set: 4,109 matches (early 2024/25 season)
- Architecture: latent dimension 128, 4 transformer layers
- Training time: ~15 hours on a single NVIDIA A10 GPU
- Optimizer: Adam with cosine annealing learning rate schedule
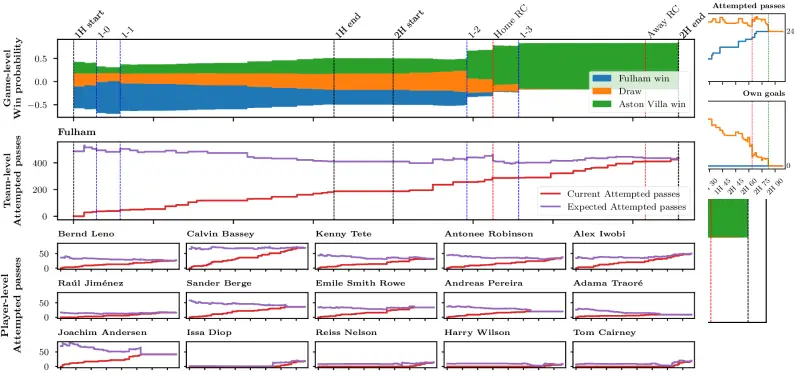
Fig. 2: Prediction dynamics throughout a match. Top — event timeline, bottom — continuously updated predictions for key metrics. Source: Horton & Lucey, 2025
Results
Prediction scale
The numbers are impressive:
| Metric | Value |
|---|---|
| Predictions per timestep | ~505 |
| Events per match | ~150 |
| Total predictions per match | ~75,000 |
| Latency | Sub-second on commodity CPU |
Model calibration
The model produces well-calibrated probabilities for most action types. Best calibration is achieved for common events (goals, assists, passes). Weaker calibration appears for rare events like red cards (probability of zero ≥ 0.84) and high-frequency actions like passes (large value range reduces individual probabilities).


Fig. 3: Detailed prediction analysis from the Fulham vs. Aston Villa match (October 19, 2024). Source: Horton & Lucey, 2025
Ablation study: what matters most?
The authors tested five model variants by removing different components:
- Full model — best results across the board
- Without agent attention — noticeable performance drop
- Without temporal attention — even larger performance drop
- Without pre-game context — significant degradation
- Stacked (not summed) axial attention — slightly worse than full model
The takeaway: both temporal dynamics and player interactions are critical for prediction quality.
Example: Fulham vs. Aston Villa
In the demonstration on the October 19, 2024 match, the model:
- Pre-game: gave Fulham a 47% win probability
- After a red card in the 62nd minute: instantly recalculated expected metrics — reducing predictions for the remaining 10 players’ actions
- Correctly zeroed expectations for substituted and dismissed players
- The final score (Aston Villa 3-1) confirmed that Fulham indeed underperformed relative to predictions
Critical Perspective
Strengths:
- Scale and speed: 75,000 predictions per match with sub-second latency — this is a production-ready system, not a lab prototype
- Unified model: a single network handles all tasks (player/team/match level), simplifying maintenance and development
- Theoretical foundation: the equivalence of axial attention to standard self-attention is formally proven, not just empirically demonstrated
Limitations:
- Football only: the architecture is tailored to football’s structure (22 players, substitutions, red cards). Adapting it to basketball or tennis would require substantial redesign
- Opta data dependency: the model is trained on 62,610 matches with detailed event annotation from Stats Perform. Reproducing these results without access to such data is practically impossible
- Fixed set of 13 actions: off-the-ball aspects (pressing, positioning, movement patterns) are not captured by the model
- Rare event calibration: red cards and penalties are predicted significantly worse than frequent events
Open questions:
- How robust are predictions when transferring between leagues with different playing styles (Serie A vs. Premier League)?
- Could tracking data (player coordinates) be integrated to improve off-the-ball predictions?
This is an arXiv preprint that has not undergone formal peer review. The authors are affiliated with Stats Perform, a company with commercial interest in such technologies.
What’s Next
Horton and Lucey’s work opens several directions:
For the industry: The model can already be used in TV broadcasts (real-time commentator aids), sports betting (dynamic odds recalibration), and club analytics (evaluating coaching decisions in real time).
For research: Axial Transformers for sports are just the beginning. Next steps may include:
- Integration with computer vision (player tracking from video feeds)
- Extension to other sports with similar «agents × time» structure
- Multimodal models combining event data, tracking, and text commentary
Notably, parallel efforts are advancing other approaches to neural football understanding: RisingBALLER treats a player as a token and a match as a sentence (an NLP analogy), while OpenSTARLab provides an open-source framework for spatio-temporal data analysis in soccer.
We’re witnessing the birth of a new class of AI systems — not mere score predictors, but digital analysts that understand the game at the level of every pass, every foul, and every substitution. And they do it faster than you can blink.
Frequently Asked Questions
Can this model be used for football betting?
In theory, yes — the model generates probabilistic forecasts that can be compared against bookmaker odds to identify «value bets.» In practice, however, bookmakers use similar (or even more powerful) models to set their odds. Consistently beating the market requires not just good predictions, but finding systematic inefficiencies.
Why does the model poorly predict red cards?
Red cards are extremely rare events (averaging ~0.16 per match). At such frequency, any model will assign high probability to the «no red card» outcome. This is a fundamental class imbalance problem, and the authors use specialized loss functions (Poisson negative log-likelihood), but the rare event prediction challenge remains unsolved.
How does the Axial Transformer differ from a standard Transformer?
A standard Transformer computes attention between all pairs of elements, which for a «time × players» matrix yields O (H²W²) complexity. The Axial Transformer splits computation across two axes — time and players — and sums the results. This reduces complexity to O ((H+W)·H·W), while maintaining mathematical equivalence to the standard approach with a specific attention mask.
Does the model work for other sports?
Not in its current form — it’s specifically designed for football’s structure (11 vs 11, substitutions, dismissals, 13 action types). However, the «axial attention across agent and time axes» principle is universal and could be adapted for basketball, hockey, or other team sports with appropriate modifications to input data and action sets.
Is access to Opta data required to reproduce the results?
Yes, and this is one of the work’s key limitations. The model is trained on 62,610 matches with detailed event annotation from Stats Perform (Opta). Open datasets of comparable scale and quality don’t exist. Researchers without corporate access could experiment on smaller open datasets (StatsBomb Open Data, Wyscout), but results may differ significantly.
References
Related
Related Articles

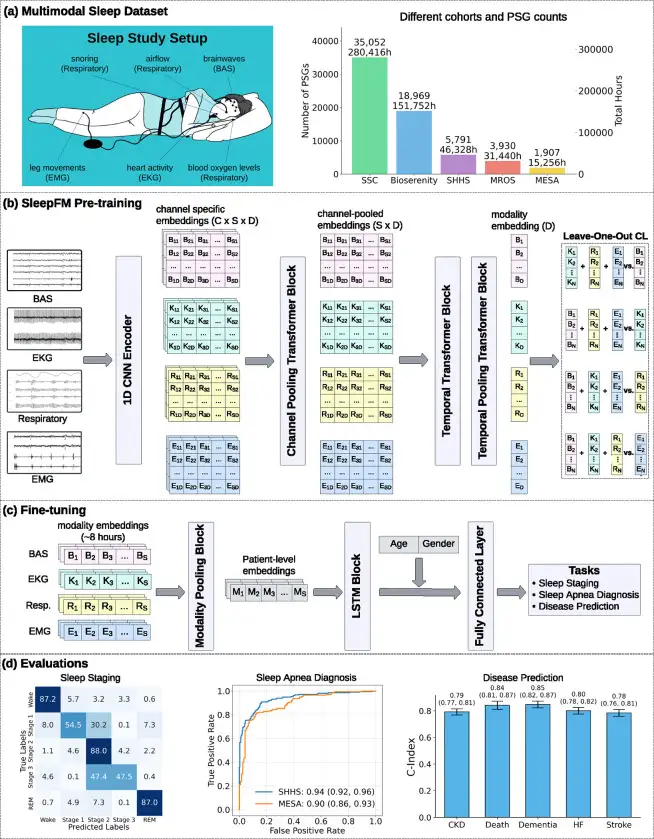
SleepFM: 130 Diseases From One Night of Sleep
Stanford trained a neural network on 585,000 hours of sleep data. It detects Parkinson's, dementia, and cancer years before symptoms appear.

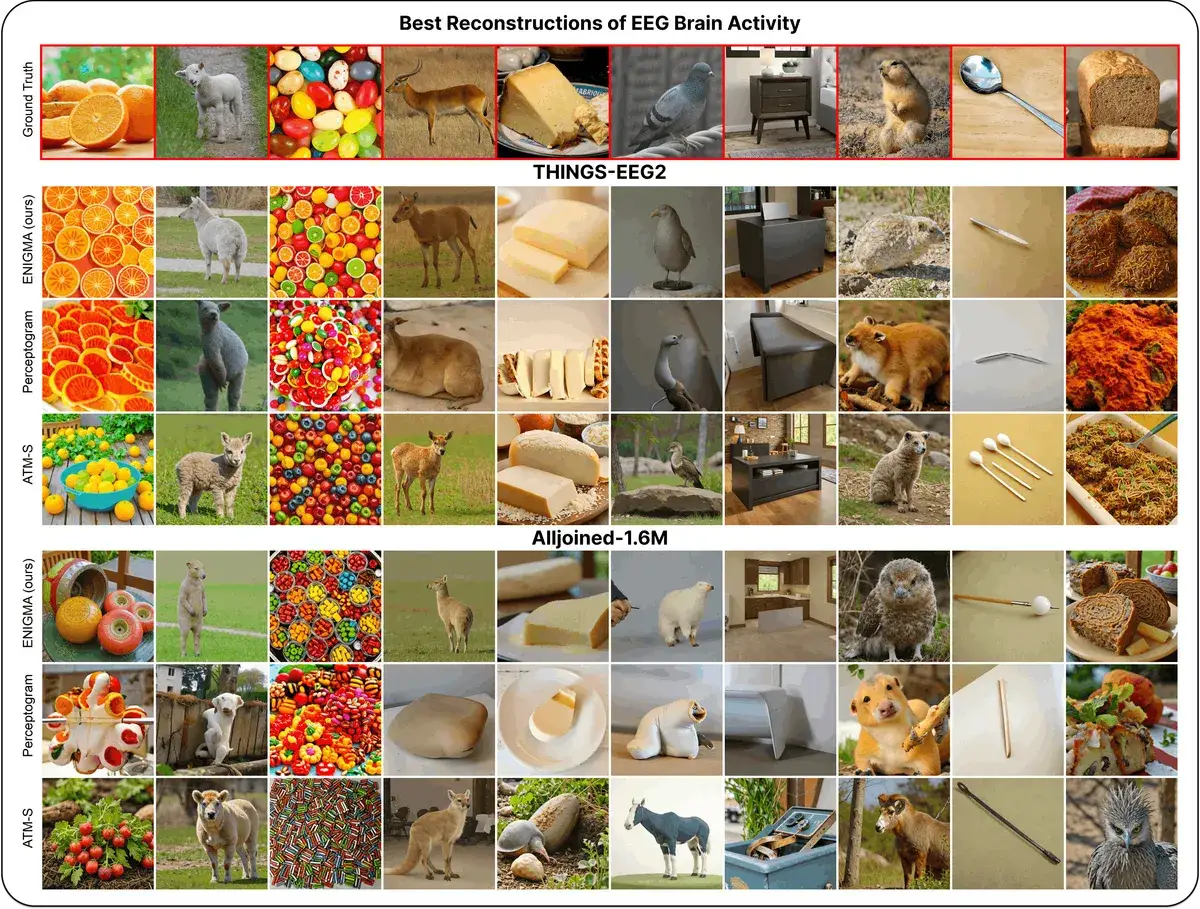
ENIGMA: Reading Minds in 15 Min via EEG
ENIGMA reconstructs images from EEG signals after 15 min of calibration, using under 1% of previous methods' parameters.


NVIDIA Cosmos 2026: Open AI That Teaches Robots Physics
Open-source platform from NVIDIA generates physics-accurate worlds so robots learn without real crashes. Free models, 12M training hours.